Per Capita Personal Income
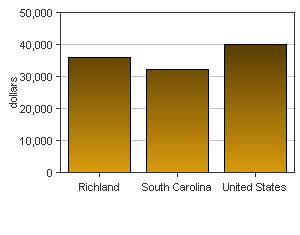
In 2008 Richland had a per capita personal income (PCPI) of $36,006. This PCPI ranked 5th in the state and was 111 percent of the state average, $32,495, and 90 percent of the national average, $40,166. The 2008 PCPI reflected an increase of 2.3 percent from 2007. The 2007-2008 state change was 1.8 percent and the national change was 2.0 percent. In 1998 the PCPI of Richland was $25,999 and ranked 3rd in the state. The 1998-2008 average annual growth rate of PCPI was 3.3 percent. The average annual growth rate for the state was 3.7 percent and for the nation was 4.0 percent.
Per Capita Personal Income, 2008
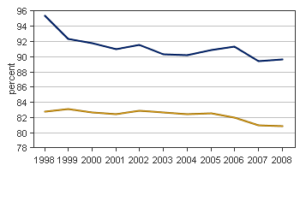
Per Capita Income as a Percent of the United States, 2008
South Carolina – Richland
Total Personal Income
In 2008 Richland had a total personal income (TPI) of $13,193,568*. This TPI ranked 3rd in the state and accounted for 9.0 percent of the state total. In 1998 the TPI of Richland was $8,184,347* and ranked 2nd in the state.
*Note: Total personal income estimates are in thousands of dollars, not adjusted for inflation.
| 2007-08 percent change | 1998-2008 AAGR | |
|---|---|---|
| Richland | 4.1 % | 4.9 % |
| South Carolina | 3.6 % | 5.2 % |
| U.S. | 2.9 % | 5.0 % |
Components of Total Personal Income
Total personal income includes net earnings by place of residence; dividends, interest, and rent; and personal current transfer receipts received by the residents of Richland.
| 2007-2008 percent change |
|||
|---|---|---|---|
| Richland | South Carolina | U.S. | |
| Net earnings | 2.9 % | 1.8 % | 2.0 % |
| Dividends, interest, and rent |
1.8 % | 1.4 % | 1.3 % |
| Personal current transfer receipts |
12.0 % | 12.0 % | 9.2 % |
| 1998-2008 average annual growth rate |
|||
|---|---|---|---|
| Richland | South Carolina | U.S. | |
| Net earnings | 4.8 % | 4.7 % | 4.8 % |
| Dividends, interest, and rent |
3.1 % | 3.9 % | 4.2 % |
| Personal current transfer receipts |
7.5 % | 8.1 % | 6.7 % |